
Create and Analyse Heap Dump in AEM
The focus of this tutorials is How to get Heap Dump in AEM and Analyse it using Eclipse MAT. When heap dump is required? What are the different approaches available to take heap dump?
Are you facing below problem in your AEM Application:-
- Getting OutOfMemoryError frequently in AEM Application.
- Application is performing slow because of frequent Garbage collection
We can take Heap Dump in AEM automatically or manually.
Automatic Heap Dump in AEM:
1. Command Line Command:-
-XX:+HeapDumpOnOutOfMemoryError and -XX:HeapDumpPath=/path/to/generate/heapdumpNote:- When using the JVM OPTS parameter -XX:+HeapDumpOnOutOfMemoryError the JVM will create a heap dump whenever it encounters an OutOfMemoryError before it quits.It is always advisable to take a heap dump for analysis, the only issue that certain servers might face is size of the dump file. More JVM_OPTs debugging Options
2. Using JMap JVM tool:-
We can use below command to take automatic heap dump from AEM Servers using JMap tool:-
- Find the process ID of AEM process using ps -ef | grep java| grep <author or publish> command.
- Run below command on console-
jmap -dump:live,format=b,file=<filename> <PID>
Note:- The option live is used to restrict the heap dump to live objects only. If you want dead objects also, simply remove this option. Format “b” (for binary) is recommended, as manually analysing dump file is very difficult due to its large size. There is an ASCII version available as well in jmap.
Manual Heap Dump in AEM:
Using AEM Console:-
- Go to system console http://localhost:4502/system/console.
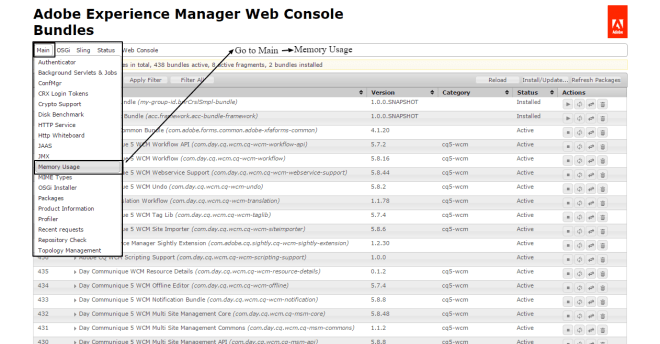
- Go to Main –> Memory Usage.

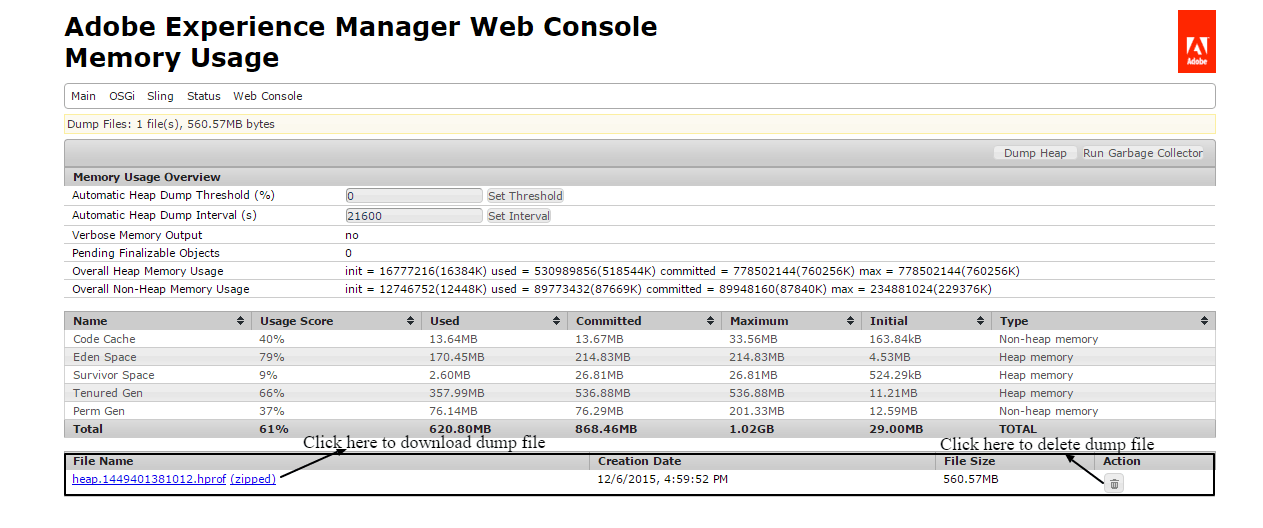
- You can set Automatic Heap Dump Threshold and interval to collect heap dump automatically at regular interval of time.
- Click Dump Heap , if you want to download heap dump instantly. For deleting heap dump click the bin icon against hprof file.

- You can Run Garbage collector or GC, if you feel that you AEM application is responding slowly.


Analyse Heap Dump in AEM:
There are many tools available in market for read, parse and analyse heap dump offline. Eclipse Memory Analyzer Toolkit (Eclipse MAT) is best of all as it is powerful, easy to use and most important its free.
After opening a heap dump in Eclipse MAT, you will get below screen.

The above objects are available in all heap dumps. Now the question is:
How to find the real root cause of Memory Leak ?
The Solution is to look for Extensive Memory Leaks and Sneaking Memory Leaks in Heap Dump.
Extensive Memory Leaks:-
The first thing to look for OutOfMemoryError in heap dump is to look for maximum Retained Heap Size as it is very important for finding leaks. Retained Heap Size is the total size of all objects being kept alive. To get this number, MAT needs to calculate the Retained Size by following all object references and displays the largest retained heaps in a pie chart.

Sneaking Memory Leaks:-
If you want to Find Memory Leaks long before an OutOfMemoryError occurs, It is also possible with Eclipse MAT by creating multiple snapshots of heap dumps.Slowly growing object counts can hint at leaks while comparing two heap dumps. Eclipse MAT allows comparing two heap dumps snapshots and finding growing structures and instance counts.
Leave a Reply